From Idea to Prototype in Minutes: Building Fast Web Apps with Dash
The fastest way to build production-grade dashboards in python
Data Scientists often struggle with translating their data insights, advanced analytics, and predictive use cases into tangible business value. One effective way to make data more interactive and accessible to users is through a product interface. Unfortunately, developing a product interface typically requires a team of full stack developers with expertise in languages like Javascript, HTML, CSS, and backend programming. However, there is a solution!
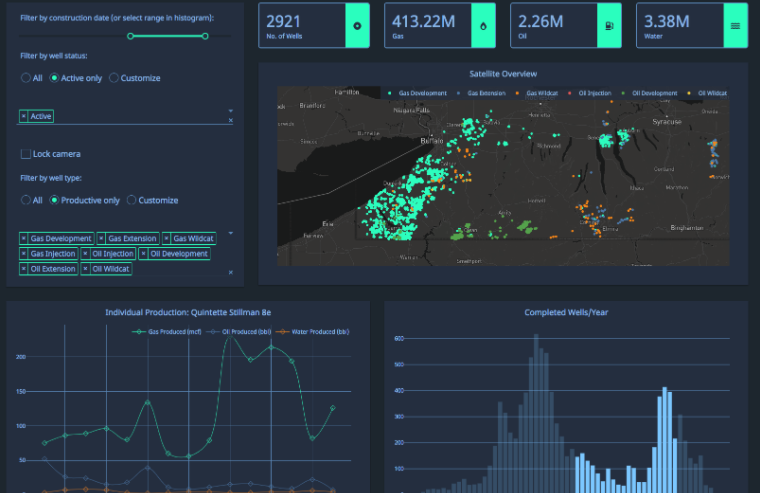
In this blog post, we will guide you through the process of developing and deploying a product interface using pure Python and the Dash library, making it much more accessible for data scientists to turn their data insights into impactful business solutions. The snapshots below showcases the potential of the Dash library for prototype development, displaying multi-level complexity, elegance, and functionalities. By leveraging the Dash framework, developers can rapidly prototype and deploy user interfaces, saving valuable time and resources.

We will guide you through the process of creating a straightforward yet effective Multi-Page Application. This application consists of two pages, the first being an interactive graph visualization selection page, while the second page integrates an external Hugging Face API for sentiment analysis.


2. Dash Overview
Dash is an open-source framework that is taking the world of interactive web applications by storm. By utilizing Flask, Plotly.js, and React.js, Dash allows developers to create Full Stack Web Applications using only pure Python code. Unlike traditional dashboarding tools such as Tableau and PowerUI, Dash enables data scientists to integrate cutting-edge technologies such as ML solutions, NLP, object detection, and complex analytics directly into the user interface. This means that decision-makers can get a deeper understanding of their data than ever before, leading to more informed and effective decision-making. Get ready to explore the limitless possibilities of Dash and discover how it can transform the way you develop and present your data.
3. Code Structure
Establishing a proper folder structure is critical as it can significantly simplify the deployment and scaling processes for multi-page applications. Let’s proceed with the creation of the required files by following the tree structure outlined below.
+---assets
|       general.css
|
+---components
|   |   __init__.py
|   |
|   +---callbacks
|   |   |   callback_1.py
|   |   |   callback_2.py
|   |   |   main_callback.py
|   |   |   __init__.py
|   |   |
|   +---templates
|   |   |   main_layout.py
|   |   |   page_1.py
|   |   |   page_2.py
|   |   |   __init__.py
|   app.py
|   app.yaml
|   index.py
|   requirements.txt
To ensure a seamless workflow, it is essential to first gather the required packages before creating the template.
!pip install dash pandas dash_bootstrap_components torch transformersapp.py file
The app.py file serves to define the initial configuration settings for the application.
- The first step involves defining the
appobject as a Dash framework object, which will be used throughout the development process to render the necessary callbacks and bridge the layout and backend together. - To incorporate the styling templates for multiple components without reinventing the wheel, we include Bootstrap into the stylesheet by defining
external_stylesheets = [dbc.themes.BOOTSTRAP]. - Furthermore, we set
suppress_callback_exceptionstoTrue, allowing components to be missing in the initial state but dynamically generated by other callbacks.
This script should remain mostly unchanged throughout the development process and should look something like this:
import dash
import dash_bootstrap_components as dbc

external_stylesheets = [dbc.themes.BOOTSTRAP]
app = dash.Dash(
    __name__,
    external_stylesheets=external_stylesheets)

app.config['suppress_callback_exceptions'] = True
index.py file
This is the primary runner file that imports the main layout and runs the application server. Similar to app.py, these files generally do not require modification for most of the development process. To direct the server to the IP address of the local machine, we must define host=0.0.0.0. This is a necessary requirement for deployment later and will be mapped to a different server in the cloud. The following code imports the app object from app.py and assigns the layout to the app.layout attribute. Finally, the server is run with the specified settings as shown below:
from app import app
from components.templates.main_layout import layout
app.layout = layout

if __name__ == '__main__':
    app.run_server(debug=False, host='0.0.0.0', port=8050)
components folder
The components folder stores all the building blocks, layouts, and callbacks used in the application. This directory contains two major sub-folders:
- The
templatesfolder contains the modules that determine what to display in the interface. Themain_layout.pymodule links up all the individual pages, such aspage_1.py,page_2.py, etc. - The
callbacksfolder contains the modules used to bring interactivity to the Dash application. Each individual layout in thetemplatesfolder should have one designated callback. For instance,callback_1.pyis responsible for the activity ofpage_1.py.
We started by creating main_layout.py, which outlines the overall structure and static components, such as the top bar and logo. The dbc tab components on the top of the layout enable the user to jump into different pages, and the content will respond to the user's selection. In the code, we created tabs to enable the user to select between Page A and Page B, and created an empty content div that will display the content of the selected page, which will be updated by the corresponding callback function.
import pandas as pd
import numpy as np
from app import app
from dash import dcc
from dash import html
import dash_bootstrap_components as dbc
from components.callbacks import main_callback

### tabs for page selection ###
tabs = dbc.Tabs([
            dbc.Tab(label="Page A", tab_id='main_tab_a'),
            dbc.Tab(label="Page B", tab_id='main_tab_b')],
        id='main_tab',
        active_tab="main_tab_a",
    )

### content to be display ###
content = html.Div(id='page_content', className='content')

### final layout ###
layout = html.Div([
        dcc.Location(id="url"),
        tabs,
        content
    ])
We will now set up the interactivity part, which is the callback. When a tab is clicked, it triggers the callback function. It is important to ensure that the input/output id matches exactly with the components’ id in the layout script. The code block below imports the necessary modules, defines the callback function and sets the output to the page_content div element in the layout. Next, we can now proceed to construct the layout for both page_1.py and page_2.py
from dash.dependencies import Input, Output
from datetime import datetime
from app import app
from components.templates import page_1
from components.templates import page_2

### update page content with selected tab ###
@app.callback(
    Output("page_content", "children"),
    Input("main_tab", "active_tab")
    )
def render_tab_content(tab):
    if tab == 'main_tab_a':
        return page_1.layout
    elif tab == 'main_tab_b':
        return page_2.layout
    else:
        return None
In page_1.py, two dropdown components are added as well as a scatter. All of these components are then combined under the variable named layout at the bottom of the script. The first dropdown is defined with an ID of xaxis-column and the second dropdown with an ID of yaxis-column. The scatter plot is created using dcc.Graph with an ID of indicator-graphic Finally, all three components are wrapped in an html.Div element and assigned to the layoutvariable.
from dash import dcc
from dash import html
import dash_bootstrap_components as dbc
import pandas as pd
import plotly.express as px
from components.callbacks import callback_1

### dropdown
dropdown_1 = dcc.Dropdown(
    id='xaxis-column',
    style={'width': '48%', 'display': 'inline-block'})

dropdown_2 = dcc.Dropdown(
    id='yaxis-column',
    style={'width': '48%', 'display': 'inline-block'})

### scatter plot
scatter_plot = dcc.Graph(id='indicator-graphic')

### final layout ###
layout = html.Div(
    children=[
        dropdown_1,
        dropdown_2,
        scatter_plot
    ]
)
In order to create interactive visualizations, callbacks play a crucial role in Dash. In this code snippet, callback_1.py supports the interactivity and output for page_1.py. It can be observed that the id names for each callback output/input match exactly with the id in page_1.py. In the first callback function, the options list for the dropdown components is updated based on the value of main_tab. In the second callback function, the scatter plot is updated based on the selected values from the dropdown components. The data for the plot is filtered based on the selected values and passed on to plotly graph function.
from app import app
from dash.dependencies import Input, Output
import pandas as pd
import plotly.express as px

df = pd.read_csv('https://plotly.github.io/datasets/country_indicators.csv')

### update options list in the dropdown
@app.callback(
    [
        Output('xaxis-column', 'options'),
        Output('xaxis-column', 'value'),
        Output('yaxis-column', 'options'),
        Output('yaxis-column', 'value'),
    ],
    Input('main_tab', 'value')
    )

def update_dropdown_options(_):
    option_list = df['Indicator Name'].unique()
    return option_list, option_list[0], option_list, option_list[-1]


### update plot based on dropdown selection
@app.callback(
    Output('indicator-graphic', 'figure'),
    Input('xaxis-column', 'value'),
    Input('yaxis-column', 'value'),
    )

def update_graph(x_axis, y_axis):
    dff = df.copy()

    fig = px.scatter(x=dff[dff['Indicator Name'] == x_axis]['Value'],
                     y=dff[dff['Indicator Name'] == y_axis]['Value'],
                     hover_name=dff[dff['Indicator Name'] == y_axis]['Country Name'])

    # update plot layout
    fig.update_layout(
        margin={'l': 40, 'b': 40, 't': 10, 'r': 0},
        hovermode='closest')

    fig.update_xaxes(title=x_axis)
    fig.update_yaxes(title=y_axis)

    return fig
In addition to simply visualizing data, our interface can also act as a conduit to external APIs or pipelines, utilizing the input from the user. This is the aim of page_2.py, where the user can enter review text into a textbox, and the model running in the backend will dynamically generate output based on this input.
To create a well-structured page, the page 2 application requires two separate scripts, one for layout page_2.pyand the other for interactivity callback_2. The layout for this page comprises a container component — dbc.Container, which is designed to position all the elements in the center of the page with appropriate space margin. The container encapsulates various components, including
html.H1: Title header with bolded text within the containerhtml.P: Normal text for descriptionhtml.Hr: A straight line to separate the title from the text boxdbc.Textarea: Text input from the user. It will serve as an input with unique id to the callback functiondbc.Button: To trigger the callbackhtml.Br: Line breaker to locate some space in between the input and outputdbc.Alert: A components to provide feedback message, the final output comes from the API.
By combining all these components, we can produce a well-organized and visually appealing container.
from dash import dcc
from dash import html
import dash_bootstrap_components as dbc
import pandas as pd
import plotly.express as px
from components.callbacks import callback_2

### text input and output ###
text_container = html.Div(
    dbc.Container(
        [
            html.H1("Sentiment Analyser", className="fw-bolder"),
            html.P("Enter Text to get the Sentiment in return"),
            html.Hr(className="my-3"),

            # text input area
            dbc.Textarea(id="input", placeholder="Type something..."),
            dbc.Button("Compute", id="submit-button", className="my-2"),
            html.Br(),

            # text ouput
            dbc.Alert(
                id="output",
                children=["This is a primary alert"], style={"visibility" : 'hidden'}),

        ],
        fluid=True,
        className="py-3",
    ),
    className="p-3 bg-light rounded-3",
)

### final layout ###
layout = html.Div(
    children=[
        text_container,
    ]
)
Let’s delve into the callback_2.pyscript for page_2. We’ll begin by importing the pipeline and model from Huggingface, along with the corresponding library name — transformers. With the model defined, we can feed the text into it and obtain the output. We require two inputs for the callback function:
- State(“input”, “value”): The input text from the textbox. It is in State instead of Input so that the callback will only store the value without triggering the next step until the button is clicked.
- Input(“submit-button”, “n_clicks”): The actual input that triggers the callback to run the function.
While there are three outputs from the function:
- Output(“output”, “children”) : The text to be printed in the output.
- Output(“output”, “color”): The background color of the printed message. It should be red for negative sentiment and green for positive sentiment.
- Output(“output”, “style”): This allows us to modify the styling. In this case, we only use it to make the output hidden when there is no text in the textbox.
Our callback function is defined as analyse_sentiment(click, text). If the input text area is not empty, the output will be computed and returned, and the message will be displayed with the appropriate background color. For example, negative sentiment will be red, and positive sentiment will be green. The style is modified to display the output only when there is text in the textbox.
from app import app
from dash.dependencies import Input, Output, State
from transformers import pipeline

model = pipeline("text-classification",
                 model="nlptown/bert-base-multilingual-uncased-sentiment")

@app.callback(
    [Output('output', 'children'),
    Output('output', 'color'),
    Output('output', 'style')],
    [Input('submit-button', 'n_clicks'),
    State('input', 'value')]
    )

def analyse_sentiment(click, text):

    if (text is not None) | (len(text) > 0):
        visible = 'visible'
        output = model(text)[0]['label']

        if (output == "1 star") | (output == "2 stars"):
            text_output = f"☹️ {output} review"
            color = 'danger'

        elif output == "3 stars":
            text_output = f"😐 {output} review"
            color = 'secondary'

        else:
            text_output = f"😃 {output} review"
            color = 'success'

    # if textarea box is empty
    else:
        visible = 'hidden'

    return text_output, color, {"visibility" : visible}
assets folder
The final components to cover are the assets folder, which mainly consists of the favicon and CSS file. The CSS file is a style sheet language used to organize and style the webpage, defining attributes such as margins, colors, and font types. Meanwhile, the favicon is an icon associated with a particular website that is typically displayed in the address bar of a browser.

Creating an assets folder in your Dash application is optional, but it can be useful for storing assets such as a favicon and a CSS file. Within the assets folder, you can create one or more CSS files to style different components of your application. In the example below, we have modified the margin for the body attribute and also created a new class called .content, which has been applied as a class modifier for the content graph (line 18 of main_layout.py).
body {
    margin: 10px;
}

.content {
    margin: 20px;
}
4. Test Run
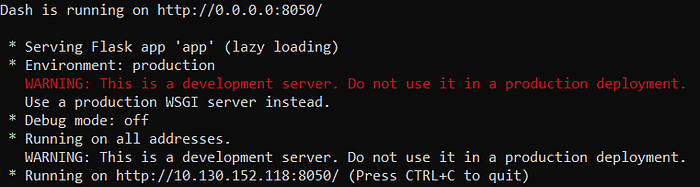
After completing the steps above, it is recommended to test the application locally before deploying it to a hosting server. To do so, navigate to the directory where the index.py file is located and run the following command in the terminal:
python3 index.pyWait until you see the output below in the terminal. Then, enter http://10.130.152.118:8050/ in your browser to see the actual interface powered by Dash!
5. Deployment
Now that we have our Dash application set up, it’s important to keep in mind that the job is not done yet, as the application can only be run locally on our machine. In order to make it accessible to the public over the internet, we need to deploy it to a cloud hosting service. This can be a challenging task, but thankfully there are many options available to us, such as Amazon Web Services (AWS), Google Cloud Platform (GCP), and Microsoft Azure.
If you’re interested in deploying your Dash application to AWS Fargate, I’ve written a separate blog post that covers the entire process in detail. This includes setting up an AWS account, creating a Docker container, and configuring the Fargate service. With this guide, you should be able to successfully deploy your Dash application to the cloud and make it accessible to the public.
6. Scaling this to production
The tutorial above provided a concise and efficient approach to develop and deploy a scalable product interface. However, when it comes to production, there are additional considerations to ensure a smooth and efficient operation of the app.
- One of the most crucial aspects to consider is dynamic data. Deploying the data together with the app at once is often not ideal, as it renders the UI less useful for making informed decisions. Instead, it is recommended to read directly from cloud databases like s3, PostgreSQL, or DynamoDB, which enable the application to fetch the latest data.
- Another issue that may arise with stand-alone applications is overloading. Heavy services like NLP models or object detection can easily cause an overloading problem in a single-engine application. To address this, it is advisable to create micro-services that can move heavy blocks into cloud platforms such as API Gateway, AWS Lambda, or Cloud Function. By taking these additional steps, the app can be better optimized for production and ensure a more efficient operation.
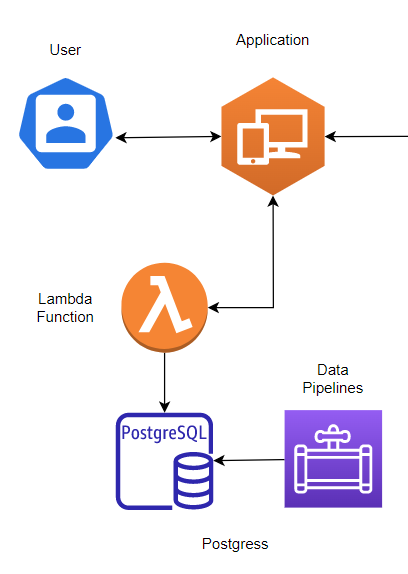
The flowchart above provides a clearer explanation of how the application interacts with cloud functions. When the application triggers a function, the serverless functions hosted in the cloud will do the majority of the heavy lifting and return the processed output to the application. This design reduces the load on the application, as it only needs to trigger and receive the output from the external function. This approach is particularly useful when dealing with heavy services such as NLP models or object detection, as it is almost impossible to run these models within a standalone application without causing overloading issues. By utilizing microservices and moving heavy blocks of processing to cloud platforms such as API Gateway, AWS Lambda, or Cloud Functions, we can ensure that the application runs smoothly and efficiently.
7. Conclusion
The power of plotly dash in developing prototypes cannot be underestimated. This blog has provided a solid foundation for building a functional prototype from scratch using Dash. With this knowledge, one can easily incorporate more robust functionalities by adding fancy design templates, function API, and ML pipelines, as well as integrating the main database. Dash provides an efficient and cost-effective solution for developing prototypes in a timely manner, and it offers an opportunity to translate ideas and proposals into initial drafts, providing better insight for all business stakeholders.
